
One common question that we hear is if surveys are truly representative of the views of an entire audience. This is a wonderful question that gets to the heart of statistics! Is the data ‘true’? We thought we’d have a look at our big data set and see what came out!
In Sara Selwood’s recent paper about cultural sector data, data facilitators were asked to describe the sector’s view of data. “The quote…‘Lies, damn lies and statistics’, probably sums up how they think about statistics” one quoted. “[They] always talk about data, and very rarely about statistics.”
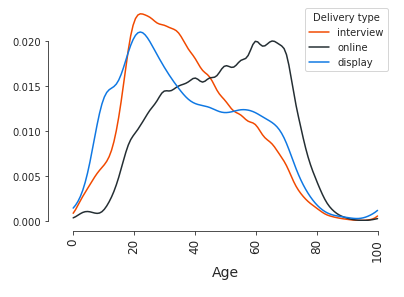
Data collection through Culture Counts can happen through online, interviews and display links. Let’s call these ‘delivery types’. Online links are generally used for email surveys. Interviews are normally collected through a tablet being managed by an intercept interviewer. Display responses normally come from an unsupervised tablet, like those at a front desk. Online links are very common because emailing people is very easy, but email surveys can make it difficult to ensure you get a representative sample of your audience. But does that mean if you don’t intercept people, you shouldn’t bother surveying at all?
Here’s what survey responses look like in our database:
- Online (63%)
- Interview (26%)
- Display (11%)
There are 1.75 million dimension responses with an age associated with them. The average age for online respondents is 48.5 years. For interview and display, the average is 35 and 34 years. It’s clear that a respondent’s age and the delivery type is correlated, but the question is this: does the delivery type affect the outcomes being measured?
To answer this question, we are first going to run a statistical test. The test we’ve picked is called a Kruskal-Wallis test. There are 82 dimensions with enough data to meaningfully run this test on. The test will compare the delivery type for every dimension and tell us if a significant difference exists within the distribution. We found that for 53% of these dimensions, there was no significant difference between delivery types.

For the 47% where we found a significant difference, the next step is to figure out how much difference there is. Before checking the difference, we need to run our test again to make sure we can separate the data from the noise.
Filtering: include only dimension + deliverable_type pairs that appear in over 30 surveys, and then dimensions that had at least 2 deliverable type categories that met this requirement.
This leaves us with 29 dimensions to check. We then create an overall mean for every dimension and compare the difference between the delivery type average and the overall average.
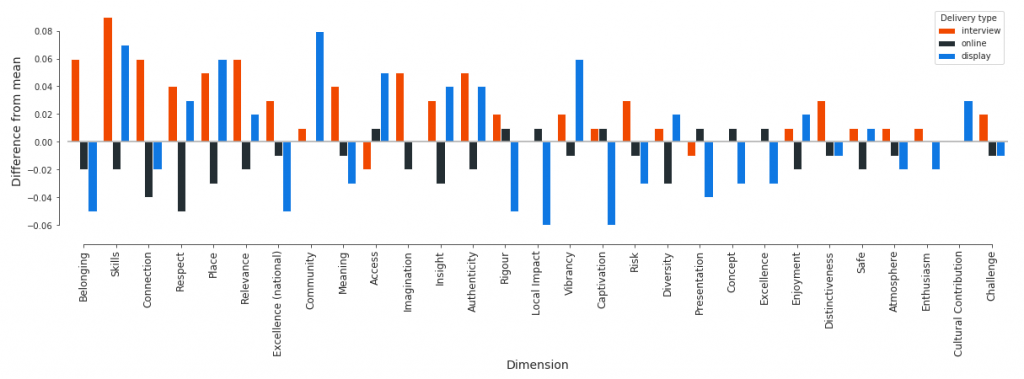
Put these all together and we find then, on average, the result for a given dimension is +2.5 points higher (on a 0-100 point scale) when the survey is delivered in person (interview), compared with +0.1 points higher when the survey delivery type is display. Interestingly, when delivered online, the mean score is -1.1 points lower than the aggregate value.
Concluding Thoughts & Part 2: Does this matter?
Knowing that there are differences is great! The question we ask when looking at data is two-fold; why are there differences and does it matter? This is about placing data in context. We’re going to look at this in a follow-up blog – explore some variables like age and gender, as well as overall variance and a bit of regression analysis. Exciting stuff!


