
A frequent question our users ask is ‘what questions do other users ask?’ We decided to dive into the Culture Counts database to look at what common custom questions our users put into their surveys. How are questions worded? How are they structured? What are the similarities? Let’s see!
Summary
Approximately 50% of the Culture Counts database is made up of custom survey questions. That means that unlike dimension or demographic questions, custom questions don’t have a set structure – they are almost entirely determined by users. There’s value in giving people free rein and seeing what questions they come up with, but this then leads us to ask if there are any patterns hidden in this wealth of data.
The answer is yes.
When we look at the 136,000+ survey questions that have been created in the Culture Counts database, we can start to see commonalities between them. In fact, 41% of all custom questions can be categorised into 31 distinct question types. For example, approximately 6.6% (9,058) of all database questions relate to a freetext box asking for additional comments, while 4.5% (6,218) ask about a respondent’s identity.
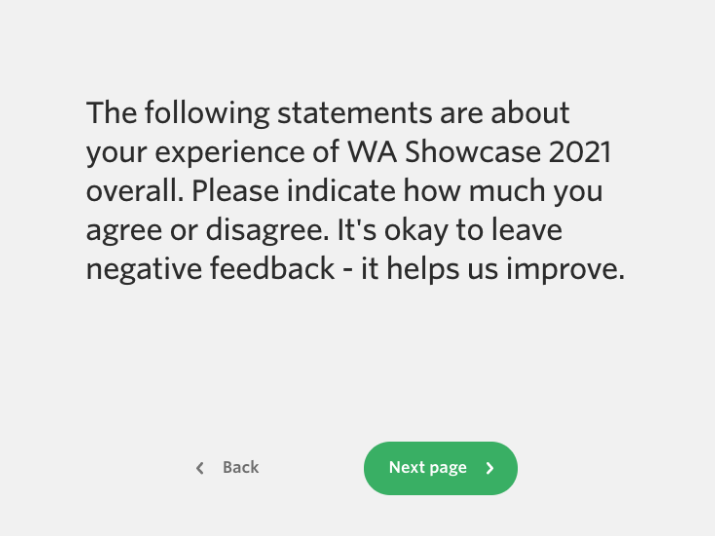
4.9% of all questions (6,723) are a pre-dimension message. Do you include these in your surveys? Here’s an example of what those look like from our friends at CircuitWest for one of their recent surveys.
Economic impact, marketing, and prior attendance questions are the next three most frequent custom questions before the numbers start to get smaller. What that means is that over 25% of custom questions in the Culture Counts database are one of the six types:
- Additional Comments (9,058 or 6.6% of all questions)
- Pre-Dimension Messages (6,723 or 4.9% of all questions)
- Identity (6,218 or 4.5% of all questions)
- Marketing (i.e. how did you hear about this event) (4,777 or 3.7% of all questions)
- Prior Attendance (4,483 or 3.3% of all questions)
- Economic Impact (3,980 or 2.9% of all questions)
We’re eager to explore how we can make this information easier for all users to see! Read on below about how Culture Counts Data Scientists Tom McKenzie undertook the research to uncover these findings.
The Problem
There is a wide range of phrasing for how similar questions have been asked in our database. As an example, a freetext type question along the lines of “Do you have any other thoughts or comments?” is often asked near the end of a survey to provide the respondents with the chance to give more detailed feedback (while providing the survey creator with a healthy dose of qualitative data to analyse).
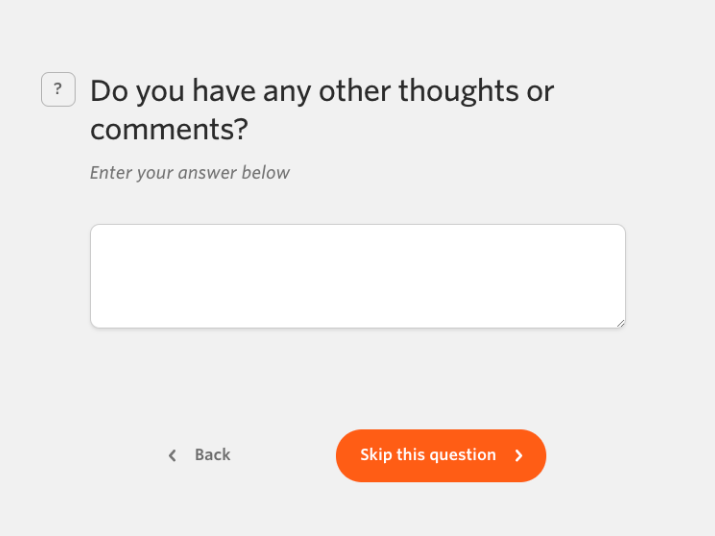
Below is a selection of the variety of different phrasings this question has been asked as:
Any other thoughts or comments?
Please share additional thoughts and comments here?
Do you have any additional comments?
Do you have any other feedback?
Is there any further feedback you would like to share?
Do you have any other comments or feedback about the event?
Would you like to make any other comments?
And so on!
As you can see, there are some similarities in how each phrasing is asked, but there are also significant differences in the specific words used as well. The challenge, therefore, is how we can capture as many of these different phrasings as possible and count them all under one umbrella of “other thoughts or comments”, without allowing in too many other questions with a fundamentally different meaning.
The Tools
The Fuzz (aka fuzzywuzzy) is a tool I find immeasurably useful when it comes to text analysis tasks. Open-sourced over 10 years ago, the tool provides a python library for partial string matching (“string” is just computer speak for text). This library was originally developed by Seat Geek to assist them with matching event titles from various sources on the internet, which might be a little messy; for example, “Cirque du Soleil Zarkana New York” and “Cirque du Soleil: Zarkana”. They found that while looking at a simple “edit distance” – i.e. how many changes you would need to make for the two strings to match – works well enough for very short or very long texts, it struggled with strings of 3-10 words, where it was “far too sensitive to minor differences in word order, missing or extra words, and other such issues”. To improve the performance in these cases they applied a number of tricks and techniques, such as looking only at the “best partial” match, looking at the words out of order, and looking at only the unique words in the string.
Given that our question texts often fall into this 3-10 word length region, the tools and algorithms developed in the library The Fuzz are well suited for us to use in this problem space!
However, matching one text to another is one thing, but what we really want is to group the questions into more generic question type categories. In other words, if we wanted to compare question ‘A’ in the database with some string ‘B’, what would that string ‘B’ be? We could compare every question to every other question in the database. But that would just show us which questions were most similar to one particular other question.
To work around this problem, a set of question “stems” was created for some predetermined generic question types. Each of these was matched to a generic question label. For example, a set of question stems for the “other comments” question type shown above might look like this:
Generic label:
“Other comments”
Question stems:
“Do you have any other”
“Do you have any additional”
“Is there any further”
“Any other comments”
This way each question in the database was tested for similarity against each of these question stems, and the closest match mean the question was assigned the generic label from the stem that it matched with (a threshold was also applied so that if no match was appropriate no label was assigned).
The analysis was repeated iteratively, where after a “run” the questions with match scores closest to (but below) the threshold were analysed and where possible new “stems” were created and associated with either existing generic labels or new labels created.
The Results
After a few iterations, we had successfully categorised over 40% of the questions in our database into 31 general question types! From these generic categories, we can visualise what some of the most commonly asked types of questions are. The figure shown here illustrates which are the most used question types for surveys created in 2021.

We also can visualise the most commonly asked question types by year to get an idea of which questions may be becoming more or less relevant for our users.

Conclusion
Text analysis is inherently messy, but with the help of fuzzy string matching we are able to parse out some insights about how our users are using the Culture Counts Evaluation Platform. Next up we’re hoping to take on the challenge of analysing what some of the most common options/choices our users give to respondents for choice based questions. Language is important, and this work aligns with our ongoing research into inclusivity and representation, with the aim of passing on this knowledge and best practises on to our users. Stay tuned!
Research and article by Tom McKenzie. Summary written by Jordan Gibbs. Culture Counts is an online evaluation platform for measuring impact – view our solutions.
