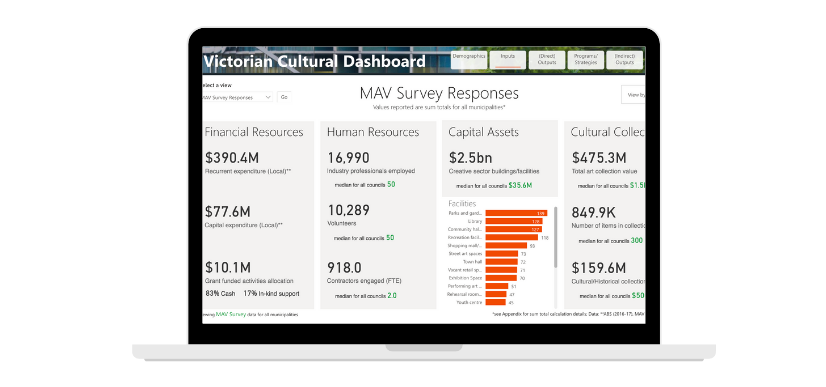
Culture Counts in collaboration with the Municipal Association of Victoria has launched the Victorian Local Government Cultural Dashboard.
The interactive dashboard brings together cultural investment, infrastructure and activities data from Victoria’s 79 local governments, to generate a snapshot of Victoria’s creative sector and the impact of local government cultural investment.
Local governments play an important role in providing essential cultural infrastructure and activities for their communities. Culture Counts partnered with the Municipal Association of Victoria (MAV) to provide councils with the opportunity to illustrate the impact and value of their cultural programs and facilities through data, and support councils in building stronger cases for support and investment. View the dashboard >
The Victorian Local Government Cultural Dashboard is designed to:
- Aggregate a variety of data sources to show the size and impact of local government cultural investment
- Help councils identify strengths, weaknesses and gaps in their provision
- Provide actionable insights to enable councils to make evidence-based decisions
- Benefit councils individually and the sector as a whole
Requirement
The first phase of the project focused on bringing together data from a wide variety of sources including MAV surveys, Public Libraries Victoria, Public Galleries Association of Victoria, Victorian Association of Performing Art Centres, Culture Counts dataset, ABS and Census data.
The data was analysed by the Culture Counts team and presented in a dynamic dashboard for ease of exploration and use. The dashboard is filterable by region and cultural activity type and presented in the following six parts:
- Demographics: Information related to the residential population and particular groups within it. E.G. age, education
- Inputs: Resources invested in the production of cultural activity. E.G. financial resources, staff time
- (Direct) Outputs: Cultural activity, attendance and participation resulting from invested inputs. E.G. events, programs
- Programs/Strategy: Plans and actions developed to respond to challenges and generate outcomes. E.G. arts strategy, business assistance
- (Indirect) Outputs: Wider benefits in community/economy that may be influenced by the resources invested. E.G. new business starts, innovation
- Outcomes: Changes resulting from producing or participating in cultural activity. E.G. skills development, enhanced community belonging
Approach
Culture Counts’ Director Georgia Moore and Data Scientist Tom MacKenzie chat about the dashboard and how to navigate it.
Next steps
The second part of the project focuses on collecting outstanding data required for the dashboard and will involve more in-depth analysis of the linkages between local government investment and the results that are generated. With a sufficiently large, consistent and complete set of data, a huge amount of interesting and valuable analysis can be undertaken into resource allocation, impacts on different demographic groups, community outcomes and flow-on effects to the economy.
Culture Counts cares passionately about the value of culture, and supporting our partners to produce richer evidence-based value stories. Are you a Victorian council? As part of our research initiatives, we are exploring creating dashboards for councils across Australia. Please contact us here if you would be interested.
Featured Product
Custom Dashboards
A dashboard for teams and large projects that brings your outcomes, outputs and third-party data in one place.


