Navigating the PLEN dashboard
The PLEN Dashboard collates the data collected in the PLEN Survey Templates and offers you the opportunity to view and compare your insights across the outcomes.
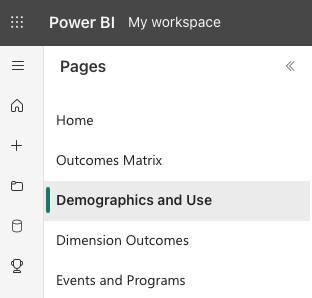
The dashboard is structured in ‘Pages’. Each page highlights a core PLEN insight.
Log into your PowerBI account
Visit https://app.powerbi.com/. If you haven’t created an account, click here for instructions.
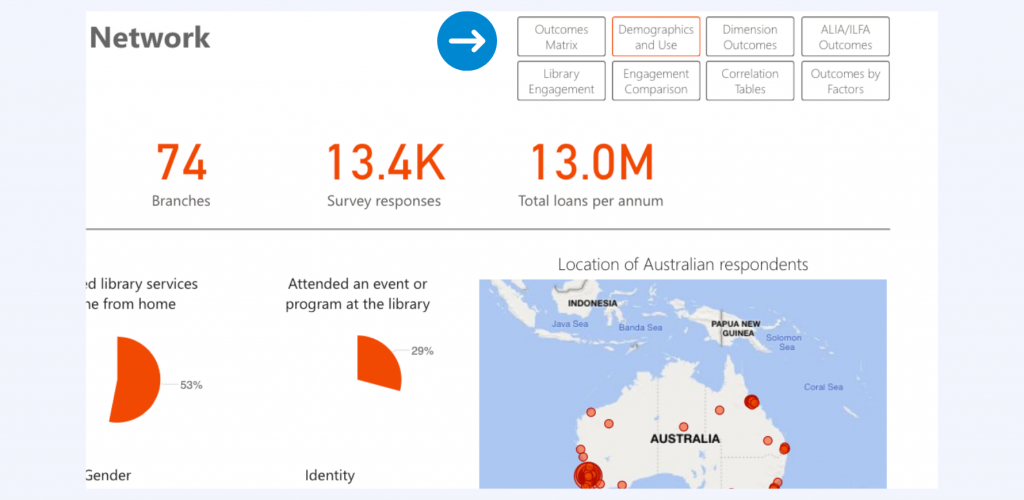
Select the insight you wish to view
The dashboard consists of pages covering different areas of interest based on the data collected via the PLEN surveys. These are segmented into Demographics and Use, Dimension Outcomes, Events and Programs, Library Engagement and more. You can select the insights via the side or top navigation menus.
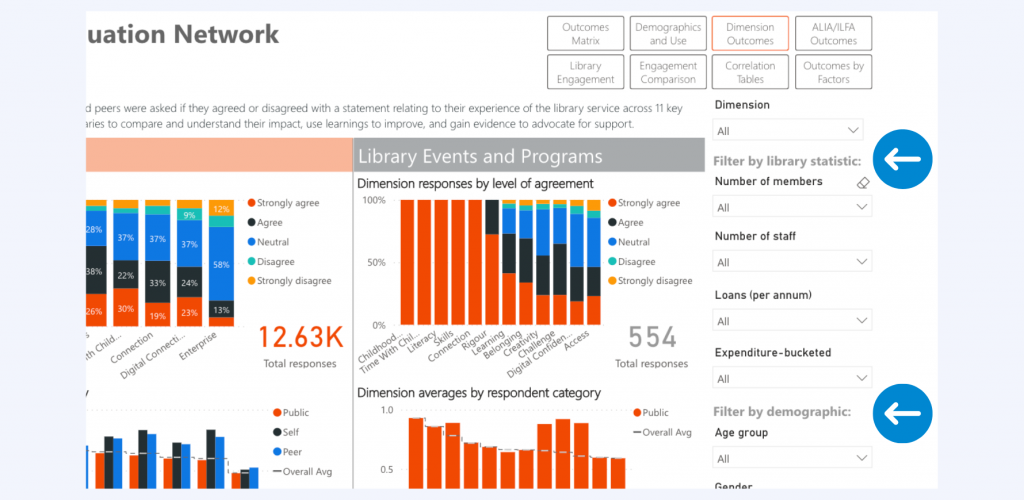
Filter the insights
You can filter the results to compare insights across libraries, branches, states, dimensions, and other library statistics such as size. To compare multiple items, hold ‘Command’ or ‘Control’ to select more than one item. For more information on filtering, visit Microsoft Power BI for tutorials.
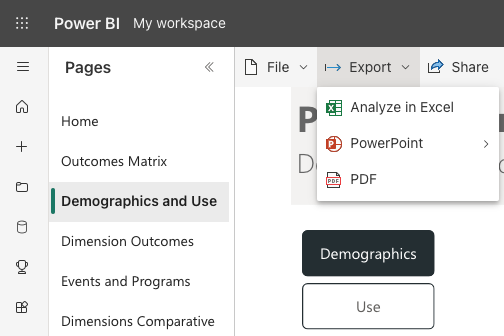
Export the insights
Once you have filtered your results to your requirements, you can export your results to share with your team. There are three options: Powerpoint, PDF or Excel.